


22%
Typically normal
The low score was from a low productivity day with a smaller amount of freight. With less volume scheduled, the line spent more time idle.
Decision: Check what was scheduled before intervening.
 Smart WarehouseOEE & Learning
A number needs a path to a decision.
I redesigned how teams interpreted Overall Equipment Effectiveness, keeping its contributing calculations visible and reducing grade-like visual emphasis. One-sheets, a five-module course, and a role-based demonstration extended that understanding beyond the interface.

Overall Equipment Effectiveness combines Availability, Performance, and Quality. The score alone could not explain whether a low result reflected expected operating conditions or a problem requiring attention. Teams needed to see what contributed to the number before deciding where to investigate.

The low score was from a low productivity day with a smaller amount of freight. With less volume scheduled, the line spent more time idle.
Decision: Check what was scheduled before intervening.

The low score was from ongoing jams, bad scans, and other interruptions that reduced Availability and Performance, even though demand was steady.
Decision: Investigate the cause and address the issues.
The meaningful question wasn’t simply “Is this number good?” It was “What changed, when, and under what conditions?”
Illustrative scenarios, not measured facility results.
A/B testing and final UAT favored keeping Availability, Performance, and Quality calculations visible alongside the result. I removed the circular gauge and grade-like red emphasis, while keeping supporting operational metrics in a separate tab.
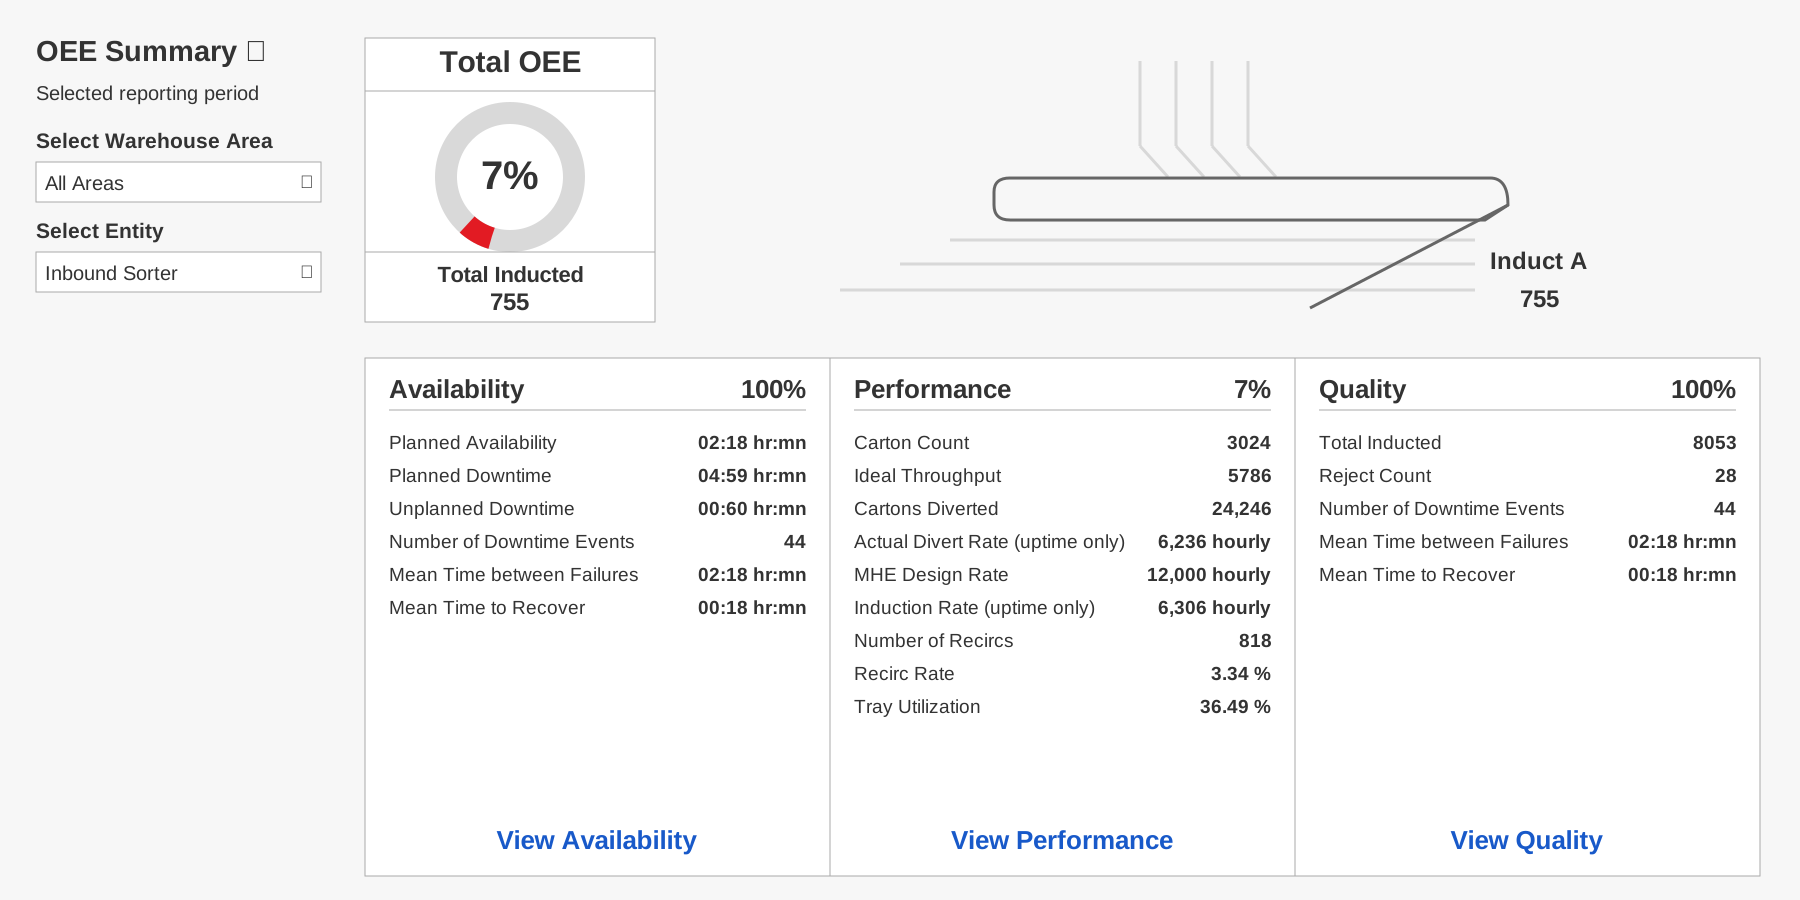
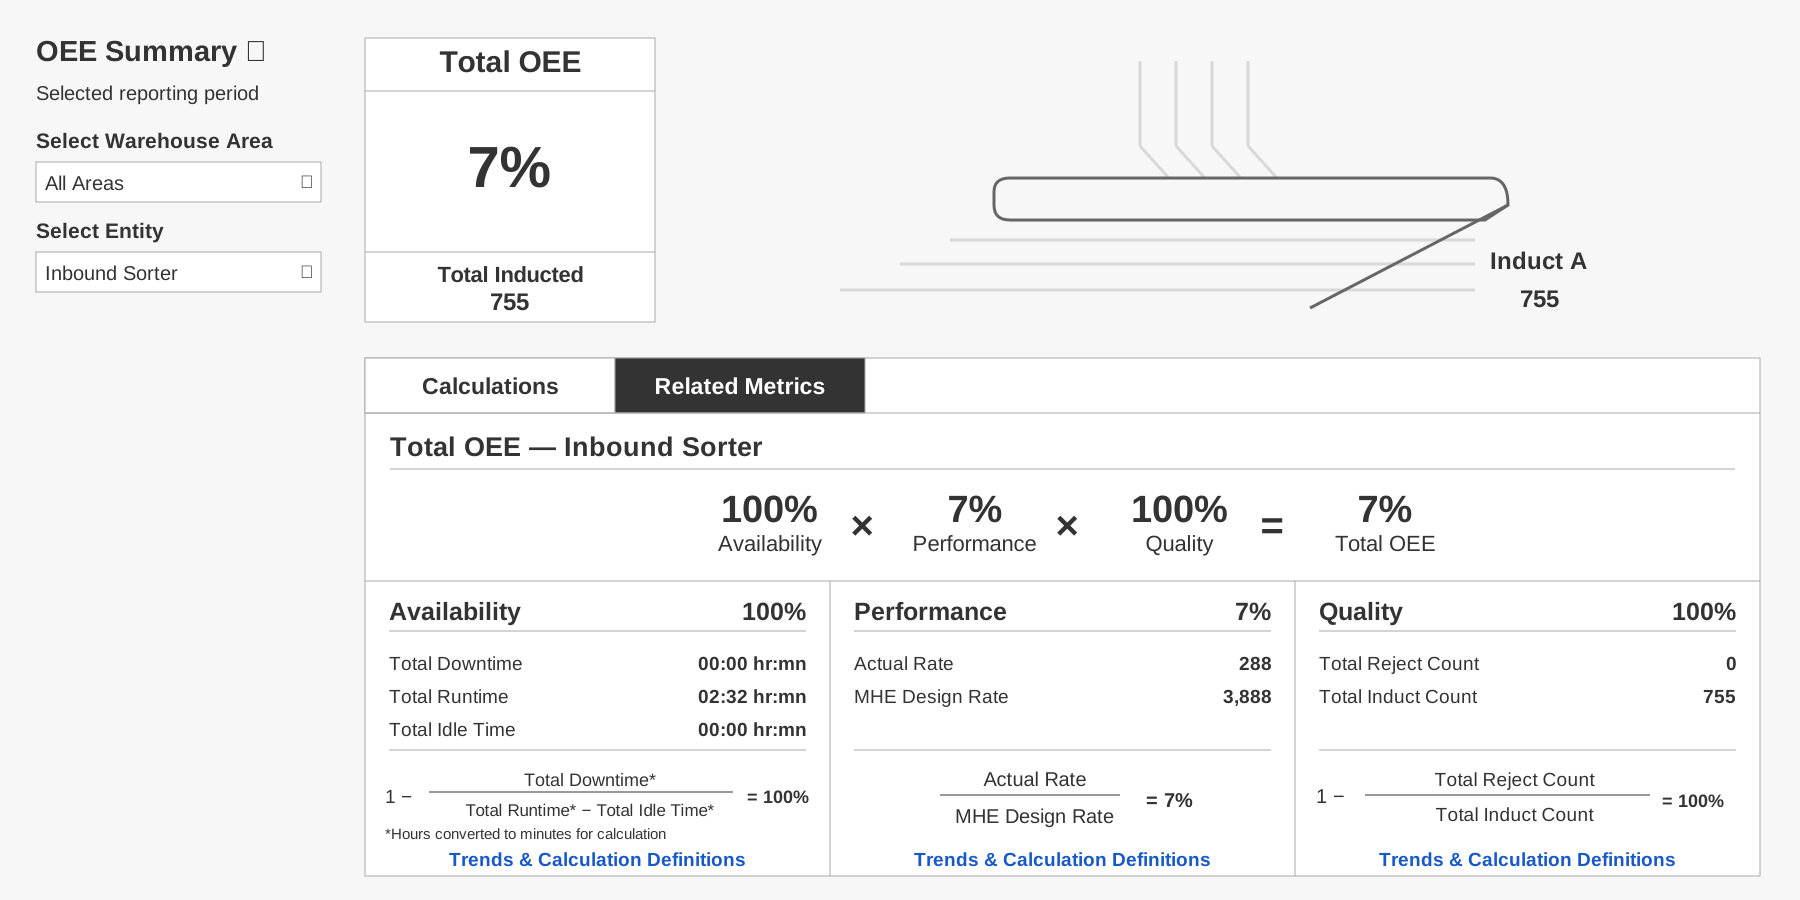
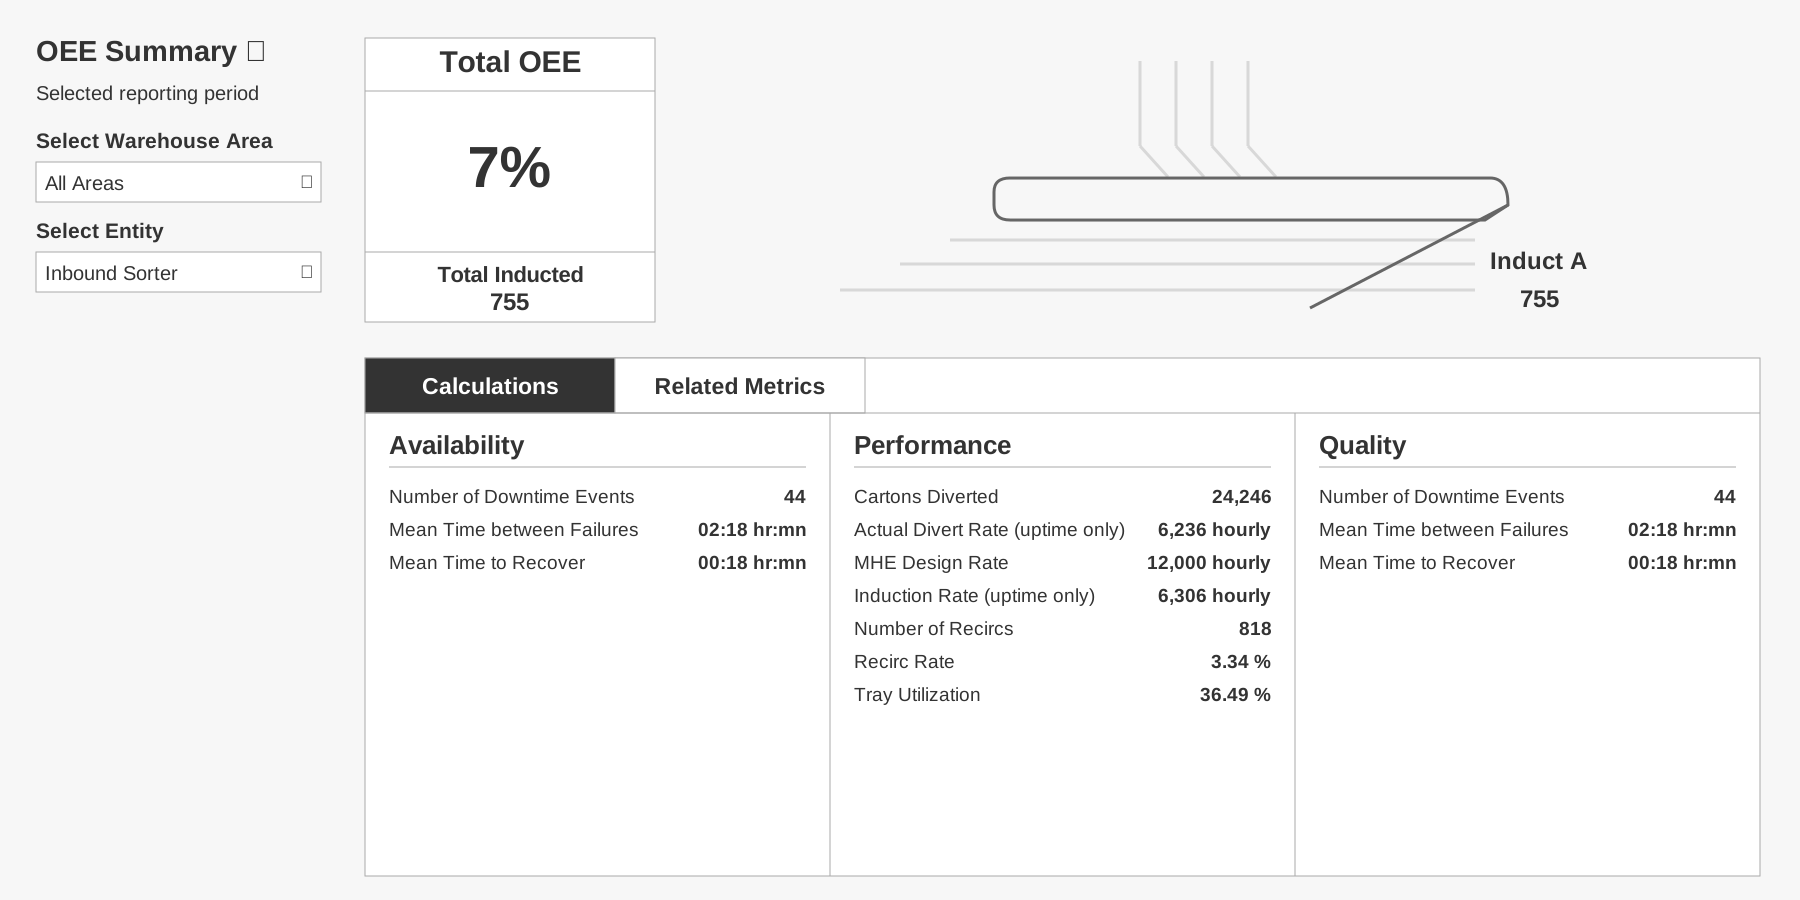
Understanding OEE also depended on explanations people could revisit. I designed two one-sheets and created a five-module Workday course, using instructional content shaped by the Product Manager.
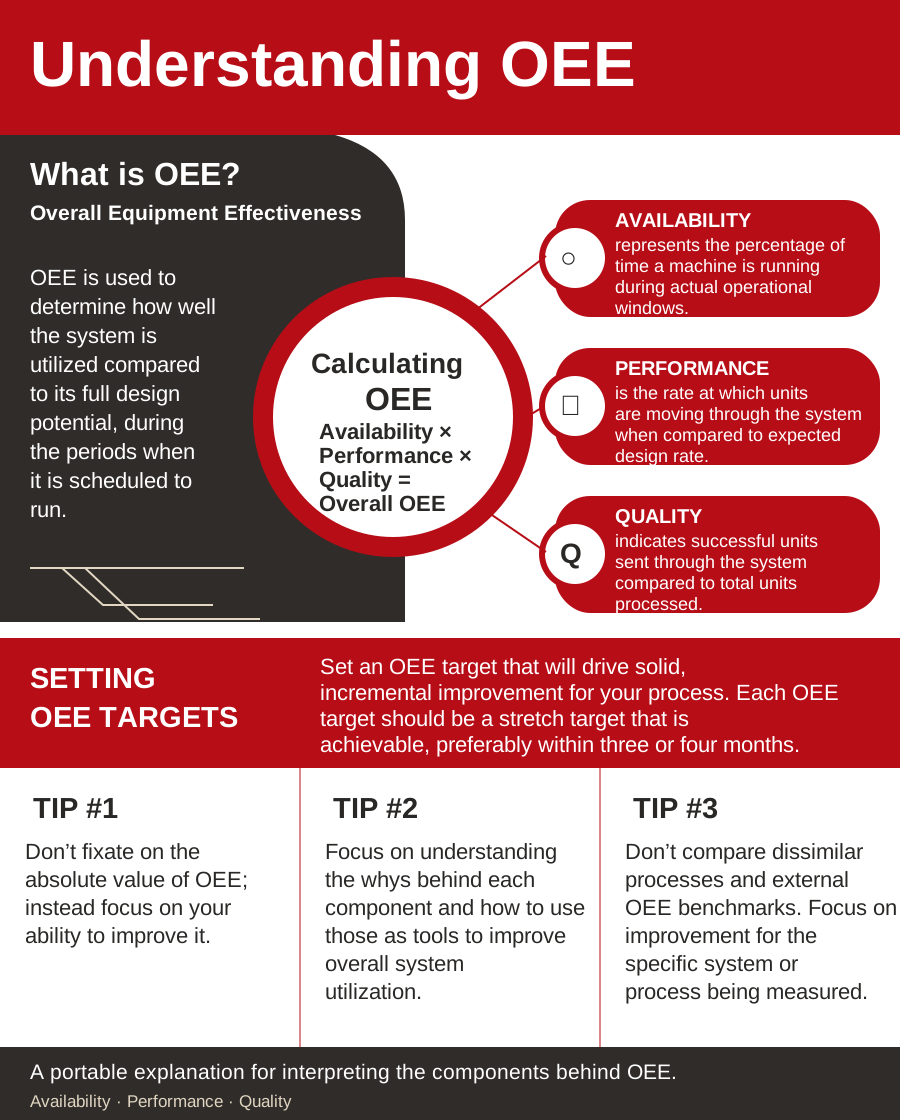
The course connected OEE fundamentals to operating scenarios, helping teams examine how daily decisions affected Availability, Performance, and Quality. Its focus was interpreting the operation, rather than learning the controls of an OEE webpage.
At Target Together, participants explored how decisions affecting Availability, Performance, and Quality combined into one shared result.
I designed the role-based interaction and visual materials. Participants entered through one of the three OEE factors, selected an operating condition, and saw its contribution to the shared calculation.
The PM and lead engineer implemented and presented the original Target Together 2023 demonstration.
Each role makes a different decision. The shared result responds to the combined effects.
Start with any role to see how an operating condition changes the shared result.
Calculated teaching example using a 24-hour planned production window and the documented scenario time losses. Percentages are example outputs, not recorded Target Together or production results. The original 2023 demonstration used the same OEE factor formula.
Later exploration · Routeweaver simulator. An interactive environment for examining how Availability, Performance, and Quality combine, separate from the original Target Together event and Workday materials. Explore Routeweaver ↗
A number becomes useful when someone can trace it back to evidence and forward to a decision.