ADDY RUTH
Staff / Principal Level Product Designer
Automation  •  AI  •  Industrial UX  •  Decision Intelligence
TARGET / MATERIAL FLOW

From Local Metrics to Whole-Building Flow

A team could hit its own target while creating a bottleneck somewhere else.

The signals existed. The shared picture did not. I connected material flow, equipment state, operating conditions, and role-specific decisions so teams could understand consequences beyond their own area and act before local problems became building-wide ones.

Explore in Smart Warehouse →IMPLEMENTED WORK · RECONSTRUCTIONS · CONCEPT
RECONSTRUCTION

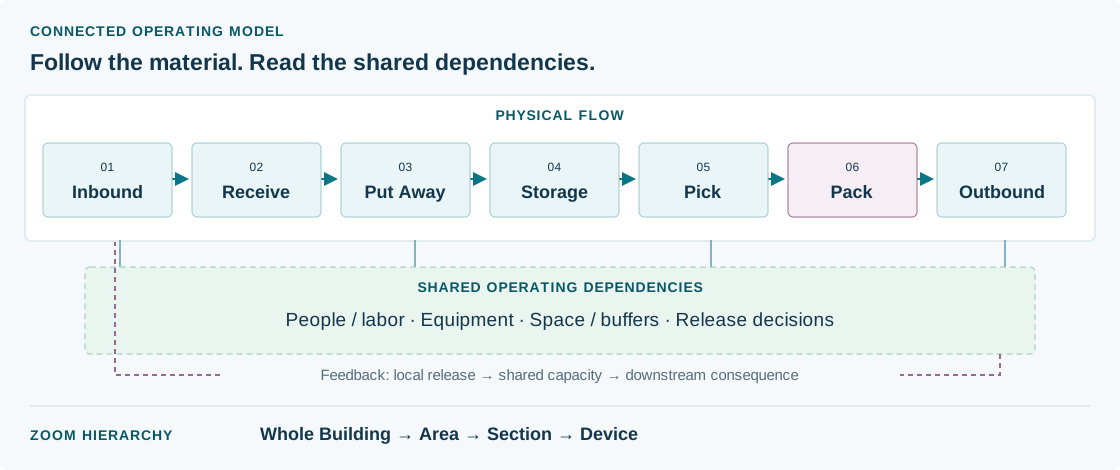
Physical flow. Shared equipment. Connected consequences.

Portfolio-safe operating model: inbound through receiving, put away, storage, pick, pack, and outbound; shared resources, feedback, and a building-to-device hierarchy
Generalized reconstruction of the operating model used to reason about connected flow. Software visibility varied by area and system. Open full model →
1
The Tension

Two views. Two clocks. No whole picture.

Operations saw near-time productivity and flow measures. Engineering had live equipment state, alarms, jams and safety context. Both were useful; neither explained the full building-wide consequence.

RECONSTRUCTION

A batch improved the station's output.
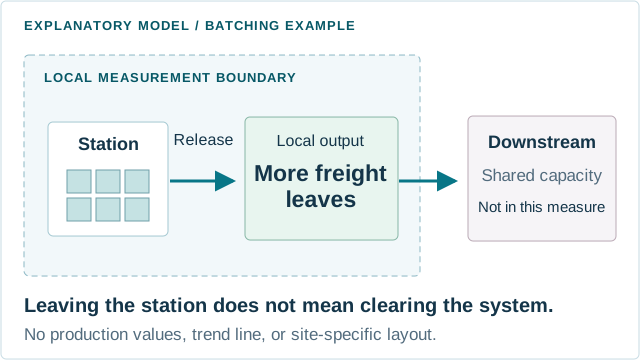
Explanatory model of the batching example: cartons collected at a station are released together, increasing local output while downstream capacity remains outside that view
The worker was behaving rationally according to the signals available locally. Illustrative releases, not a production screen or measured trend.

Operations clockNear-time operational measures: release, rate, and throughput.

RECONSTRUCTION

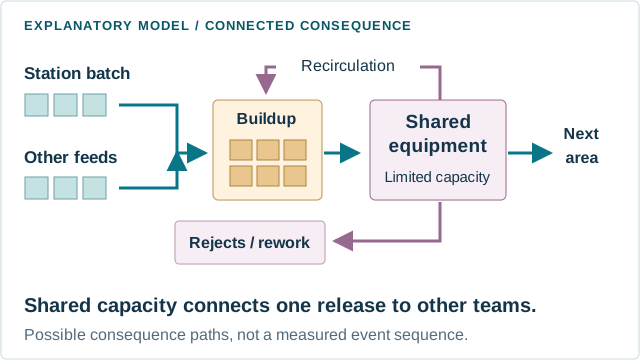
The shared equipment absorbed the surge.

Explanatory model: a batch joins other feeds at shared equipment; constrained capacity can create buildup, recirculation and rejected freight requiring rework
Shared capacity connects one release decision to other teams and downstream work. Positions and carton counts are illustrative.

Engineering clockLive equipment signals: availability, alarms, and jams.

Local success ≠ system success.

Preparing several cartons and releasing them together could improve station performance while creating a surge into shared automation. Congestion, recirculation, or rejection could follow. The worker’s decision made sense locally; the missing view was its downstream consequence.

2Research + System

Research revealed one connected operating system.

~30-minute adjustment rhythm

A stronger site checked, adjusted, and rechecked at roughly 30-minute intervals. Earlier visibility mattered because useful intervention windows could close quickly. This was observed practice, not a prescribed response time.

LEGO flow model

Teams used LEGO to explain material flow and dependencies. The physical relationships were easier to understand through a shared model than through the software: the gap was not simply data, but a shared mental model.

Excel + Splunk

Sites built Excel and Splunk tools for First Pass Yield, rejects, recirculation, gap timing, labor, maintenance, and local reporting. Different metric requests revealed pieces of the same Material Flow problem.

The operation was continuous. The systems representing it were not.

RECONSTRUCTION

Whole Building → Area → Section → Device

Whole buildingGeneralized hierarchy

Read the connected path.

Follow freight from inbound to outbound; a shared merge can constrain several upstream areas.

System boundaryContinued on vendor-controlled system

At the observed Intellimerge boundary, material kept moving beyond Jetson visibility. Different software, terminology, metrics and access could separate the next decision from the physical flow. Engineering visibility, external escalation, physical inspection and tribal knowledge helped bridge that gap.

Generalized reconstruction based on the observed workflow. No internal UI or site-specific layout is reproduced.

RECONSTRUCTION

How the problem changed

  1. 01Local metric requestsA site asks for another measure.
  2. 0220+ applications + local toolsSplunk and Excel fill visibility gaps.
  3. 03Repeated cross-site needsDifferent requests reveal related decisions.
  4. 04Shared Material Flow modelConnect the whole-building operating picture.
  5. 05Earlier operational decisionsMake downstream consequence understandable.
Reconstructed from recovered research synthesis and the older Target FigJam. Cross-site comparison exposed a connected problem; it does not imply research at every Jetson site.
3
The Pattern

One shared model. Different decision context.

Operations, Engineering, and Leadership need a consistent view of the event. What deserves attention depends on the decision each role must make.

RECONSTRUCTION

Early design / decision model

  1. 01Local metricWhat changed here?
  2. 02System consequenceWhat else does this affect?
  3. 03Shared operating pictureKeep the physical relationships consistent.
  4. 04Role-aware decisionChange the evidence emphasis, not the shared truth.
DecisionWhat decision does this role need to make?
OperationsAdjust the operating plan

Release timing, priorities and labor in flow context.

Engineering / LeadershipInterpret availability or wider impact

Engineering investigates equipment; Leadership reads building-level consequence.
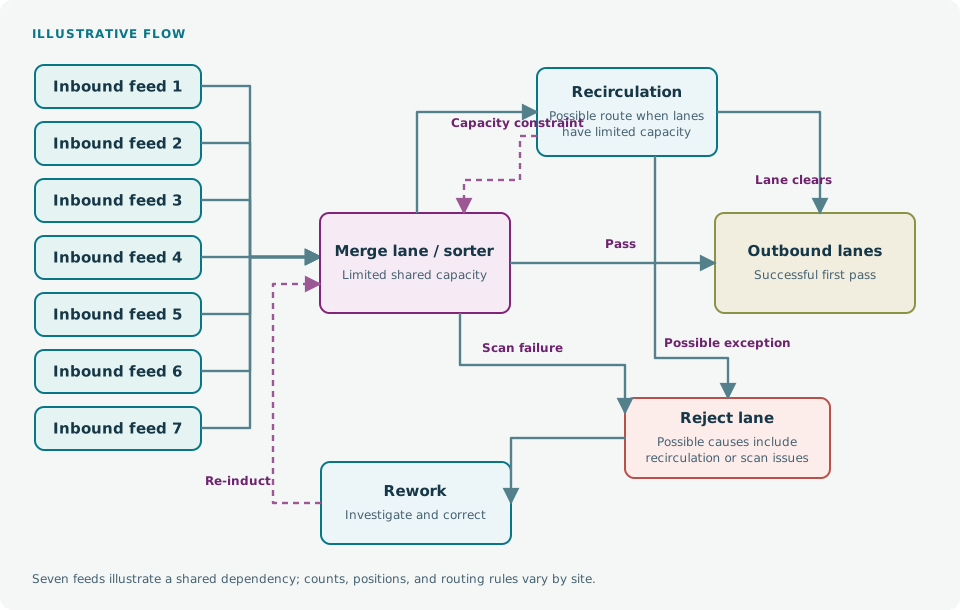
An early-thinking reconstruction of the research reframe, not a preserved original sketch. The developed role model above tests the same shared-picture principle.
RECONSTRUCTIONSeven inbound feeds share a merge, with outbound, recirculation, rejection, and rework paths

The map stays fixed. Select a role to change the evidence emphasis and decision.

Operations / flow and labor

Which plan should change?

Evidence emphasisRelease rate, downstream accumulation, and available labor.

  • Where is flow slowing?
  • What is accumulating downstream?
  • Do labor or priorities need to change?
  • How much runway is left?
  • Should release behavior change?

Decision: assess labor, priorities, or release timing; then recheck downstream effects.
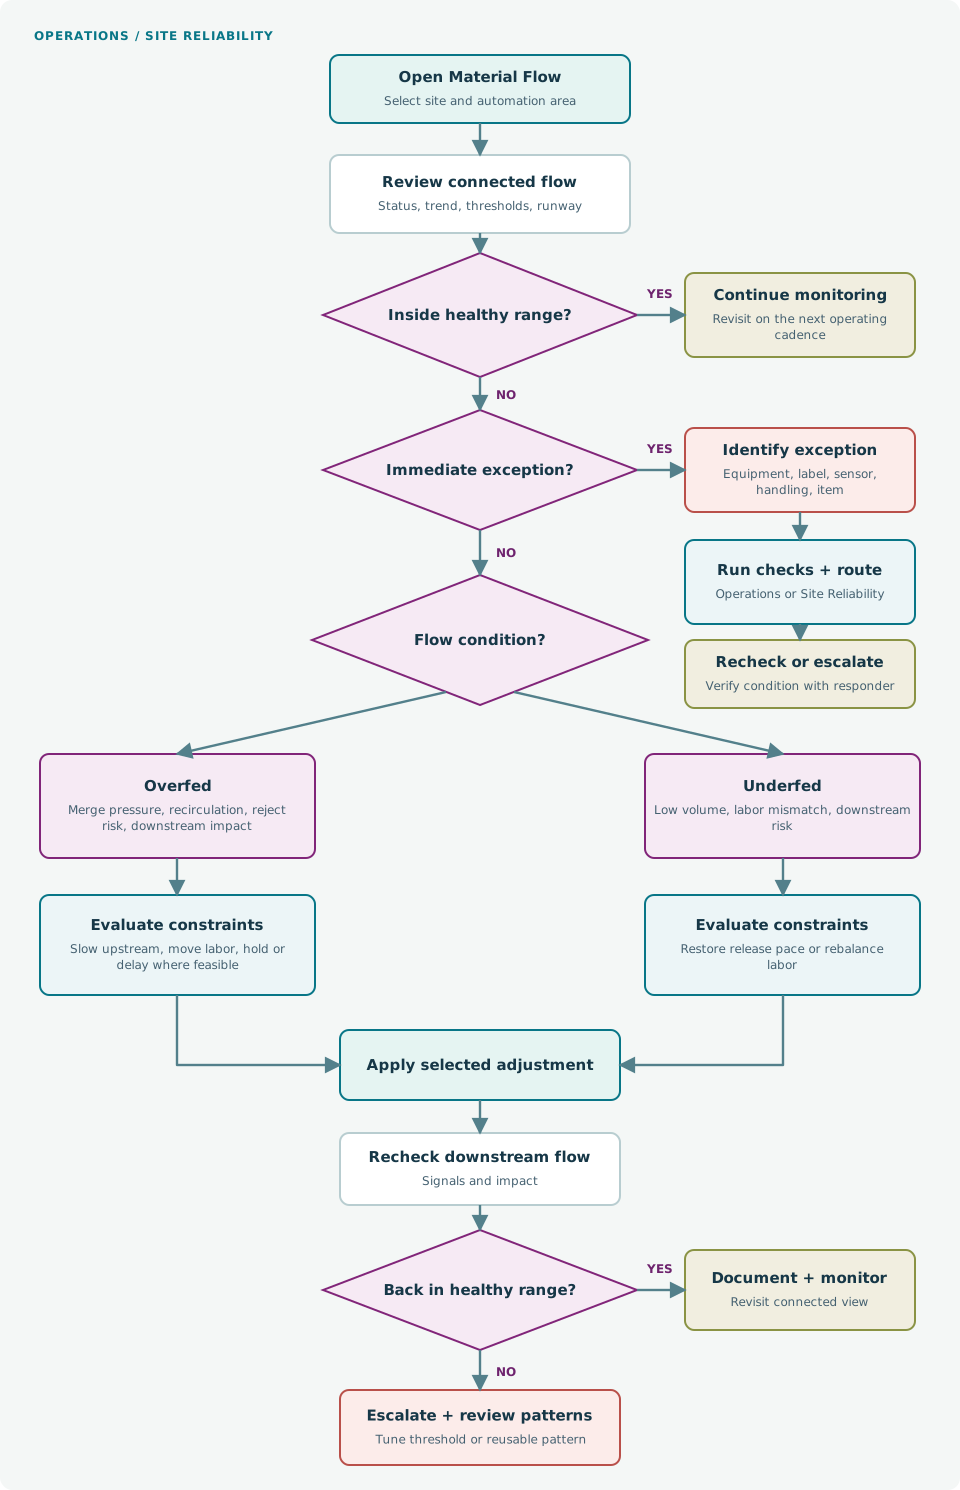
Inspect the working decision flow
Decision flow: check shared state, identify healthy or exceptional flow, classify overfed or underfed, evaluate an adjustment, and recheck downstream effects

Scroll to follow the full decision flow, or open the full-size version below.

RECONSTRUCTION · Simplified from the working decision tree. Each response returns to monitoring; the ~30-minute cadence is a field observation, not a measured response-time improvement.
Open full-size decision flow

Shared truth stays stable. Emphasis and action change by role.

4
Design Decisions

From telemetry to intervention runway.

Keep measured state, interpretation, and projection distinct. Synthesize available evidence early enough for people to act; the concept does not claim precise forecasting.

RECONSTRUCTION

Whole-building dashboard evidence

  1. 01Current stateWhat is happening across the building?
  2. 02TrendIs the condition developing or recovering?
  3. 03Site thresholdWhat matters in this operating environment?
  4. 04Intervention runwayIs there still time to investigate and act?
  5. 05Local drill-downFollow the evidence to area, section and device.
Reconstructed information model supported by the older FigJam. No historical production dashboard or validated predictive capability is reproduced.
SMART WAREHOUSE / INTERVENTION RUNWAYCONCEPT INTERACTION
HealthyDevelopingIntervention windowCritical
Measured / simulated inputs
Induction
↑
Output
↓
Recirculation
↑
Rejects
Verify trend
Equipment state
Verify condition
Simulated trends, not item-level carton tracking. Arrows indicate direction, not magnitude; rejects and equipment require independent checks.
Interpreted

Developing

Flow is deteriorating downstream.

Projected~30 min

An illustrative window to investigate before intervention becomes urgent.

Scenario estimate · not a validated forecast. Concept timing is separate from the observed research cadence.
Check the downstream cause before changing the release.Try the full prototype
01

Connect the signals

Read flow metrics as one operational system, not isolated reports.

02

Preserve decision context

Keep the shared model while changing evidence and emphasis by role.

03

Create runway

Surface developing conditions before intervention becomes difficult.

Preserve meaningful site variation. Shared patterns still need to accommodate equipment, signals, terminology, thresholds, and controls. Inspect the scaling model →

Give people enough runway for judgment to matter.

Try the connected prototype →
RECONSTRUCTION

Follow a developing constraint

  1. 01 · Entry point

    Detect the developing condition

    Schematic view / evidence

    Induction rises while downstream output falls; recirculation is changing.

    User action
    Open the affected area.
    System / shared response
    The building view narrows to the area without losing its connected path.
    Next → state 2
  2. 02 · Workflow state

    Compare flow evidence

    Schematic view / evidence

    Upstream release · downstream accumulation · site thresholds.

    User action
    Compare upstream and downstream trends.
    System / shared response
    Local performance can be read alongside the shared constraint.
    Next → state 3
  3. 03 · Workflow state

    Inspect equipment context

    Schematic view / evidence

    Availability · current state · active intervention · system boundary.

    User action
    Check whether equipment or operating behavior explains the constraint.
    System / shared response
    Equipment context informs the next decision; missing vendor evidence stays unresolved.
    Next → state 4
  4. 04 · Workflow state

    Choose the response

    Schematic view / evidence

    Connected flow evidence and equipment context, not an isolated metric.

    User action
    Determine whether an operational adjustment or Engineering handoff is appropriate.
    System / shared response
    The response stays with the role able to act.
    Next → decision below
DecisionWhat does the evidence support?
Flow issue → operational adjustmentAdjust release, labor or priorities

Change the operating plan within the user’s authority, then inspect the downstream effect.

Equipment issue → Engineering handoffPass location, state and affected flow

Engineering investigates the equipment or vendor boundary; an alert alone does not authorize intervention.

Resulting state / return to evidenceRecheck downstream state

Both paths return to the shared flow picture. If the constraint persists or evidence is incomplete, continue investigation.
Detailed wireflow reconstruction: schematic evidence and task states, not historical screen captures. The ~30-minute intervention window is a future operational concept grounded in observed cadence—not carton-level tracking or a validated forecast.
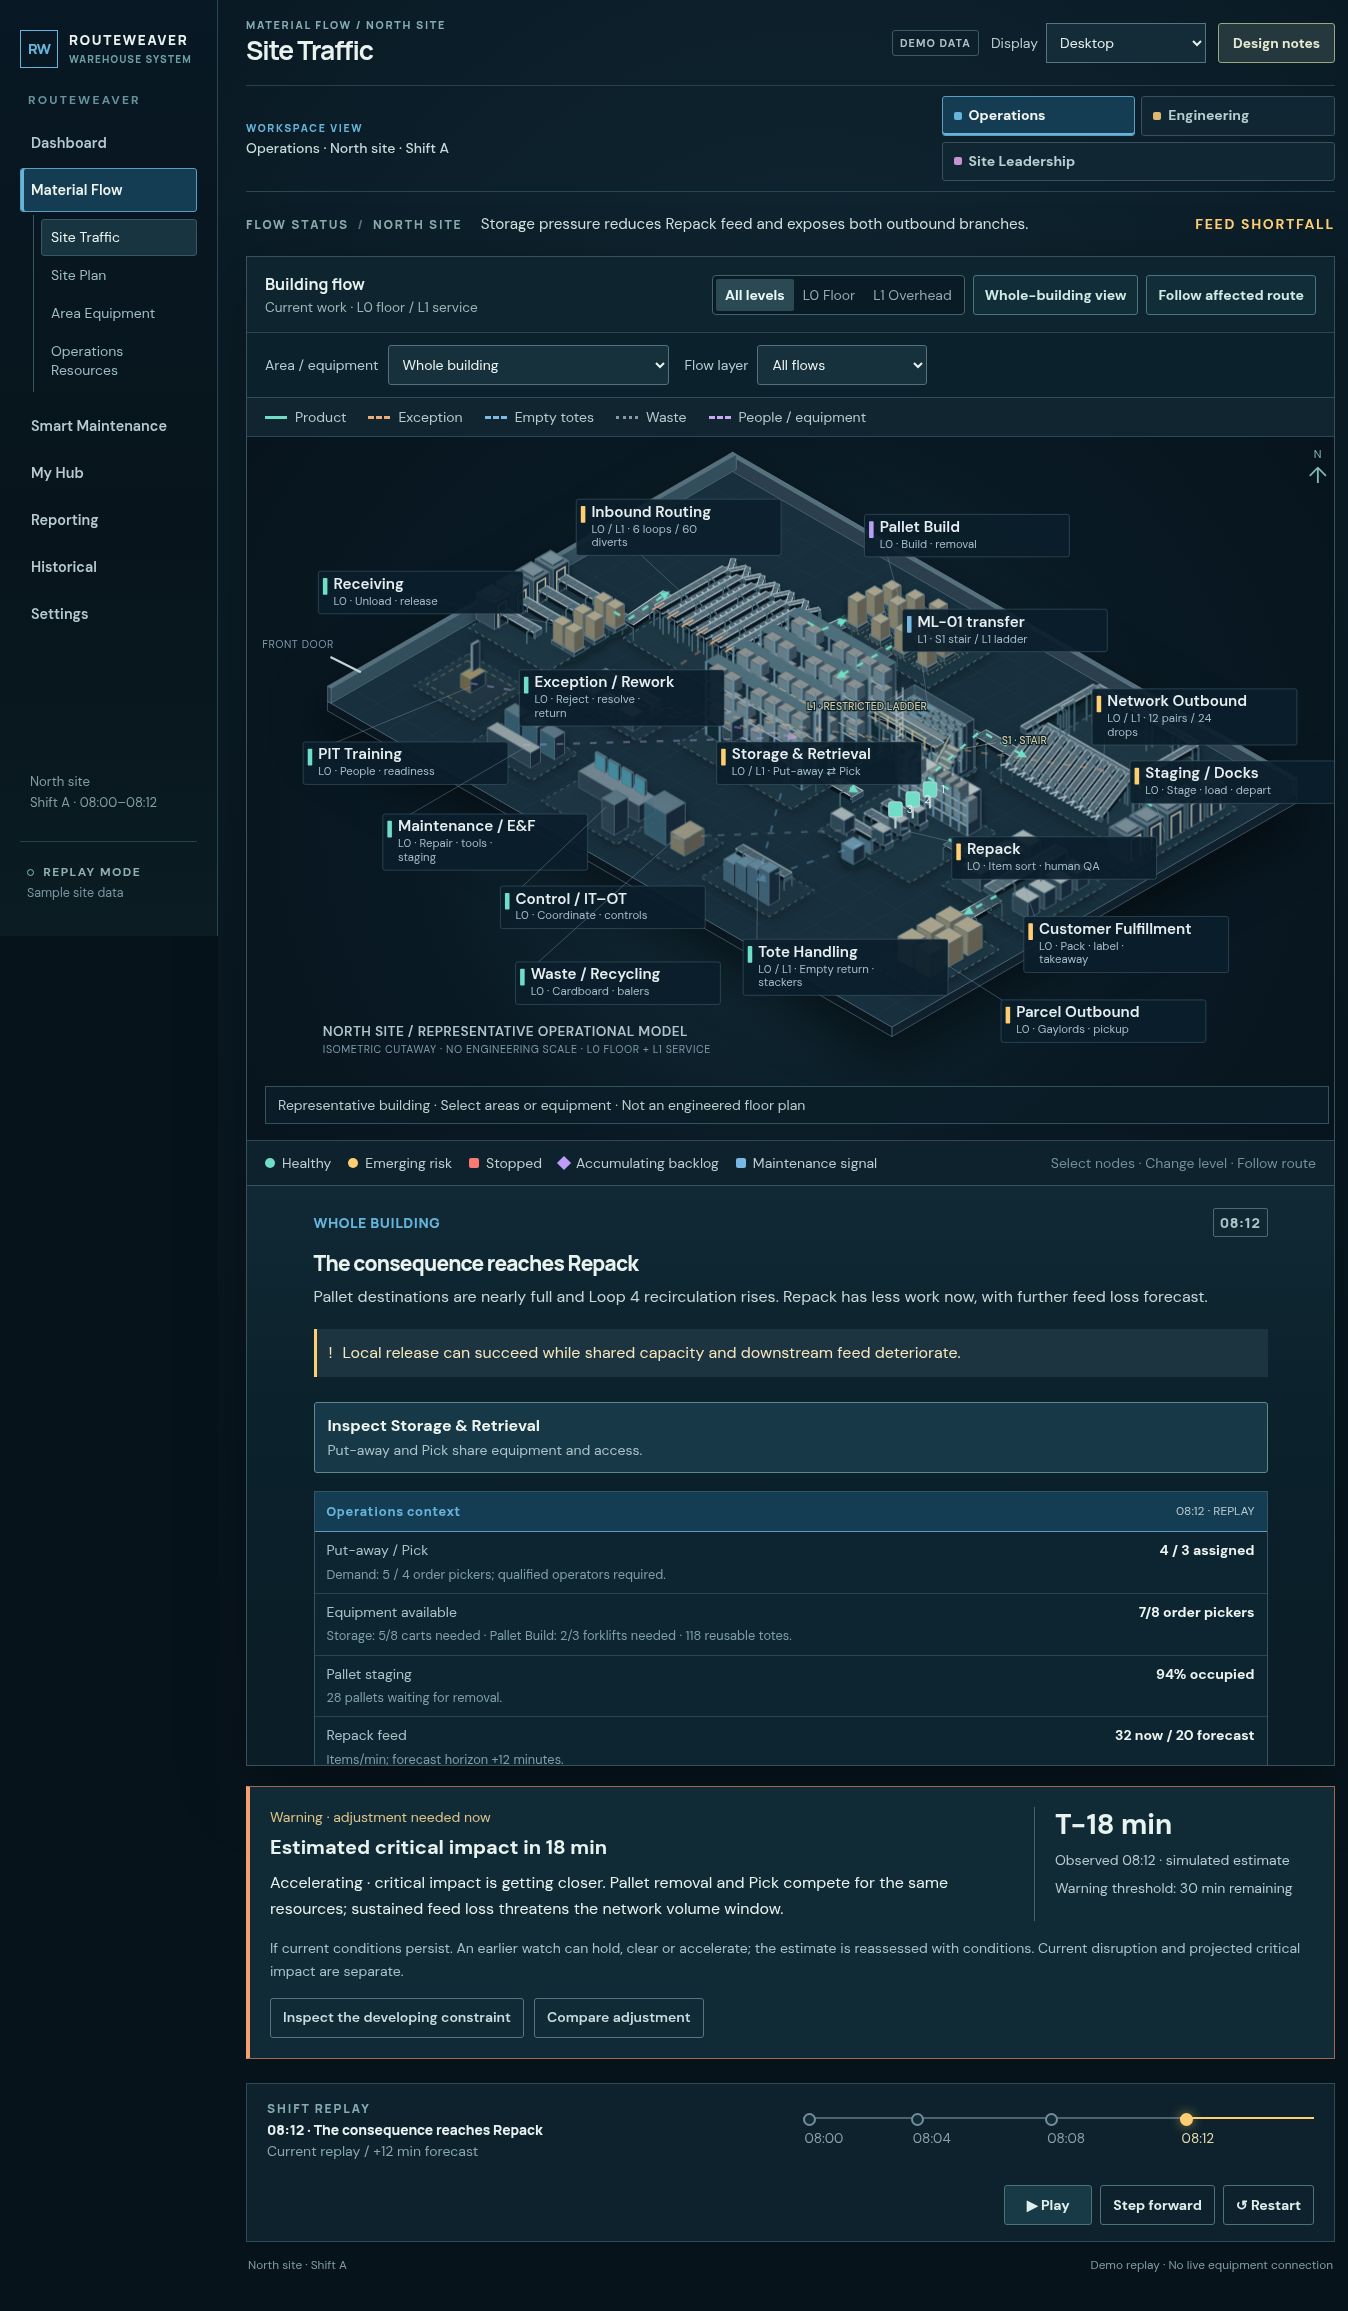
CURRENT PROTOTYPE · RECONSTRUCTION · SIMULATED DATA

The consequence reaches Repack

Routeweaver Site Traffic shows the whole-building map, shared resource demand, reduced Repack feed and an illustrative eighteen-minute warning.
Current coded prototype: shared capacity and downstream consequence appear alongside the simulated flow state. Scenario: Material Flow → Site Traffic → constrained state. View full-size screenshot ↗ Explore the prototype ↗ View full-size screenshot →
5
Impact in Reality

What shipped, what we observed, and what remained directional.

Implemented work addressed orientation and interpretation. Connected intervention runway remained a future direction.

IMPLEMENTED

3 sitesGaptimizer

  • Orientation, reporting, navigation and label improvements.
  • Training, metric one-sheets, and explainers.
  • Shorter, role-appropriate summaries.
Observed

Evidence from use

  • Positive site and UAT feedback.
  • Voluntary training adoption and fewer recurring support themes.
  • Pilots and feedback supported broader expansion.
  • Demand for connected capabilities; site behavior exposed remaining relevance problems.
Future direction

Whole-building runway

  • Stronger downstream inference and earlier interpretation of developing conditions.
  • Enterprise repository and shared foundation.
  • Cross-site capability reuse and connected maintenance decisions.
Interpretation was part of the product

A number needs a path to a decision.

What changed? Where did the number come from? What else is affected? What can this role change? Metric explainers connected the signal to an operating decision.

See OEE Interpretation & Simulation →
What I would measure next

Time to locate and classify a problem; time to adjust after risk appears; repeat support questions; training use; and issues caught before severe congestion.

Progress included shipped fixes, observed use, and a clearer future direction. These categories stay separate throughout the case.

CONCEPT / DIRECTIONAL · RECONSTRUCTION

Future-state flow concept

  1. 01Whole-building flow mapRead connected paths instead of isolated metrics.
  2. 02Healthy / at risk / stoppedUse state to orient attention.
  3. 03Site → area → section → deviceKeep context while moving into evidence.
  4. 04Handheld / QR contextBring the relevant location into field investigation.
  5. 05Maintenance connectionConnect equipment availability to operating consequence.
Future-state reconstruction of the subway-map / stoplight direction. Handheld, QR and maintenance connections are concepts, not a shipped whole-building experience.
Deeper analysis / Projected architecture

Standardize the repeatable model. Preserve meaningful differences.

Current / copies drift
Site A→Copy to B→Copy to C

Local changes diverge. Maintenance repeats.

Proposed / shared foundation
Enterprise source of truth↓Site-specific configuration
Projected architecture
~90%Reusable foundation~10%Meaningful site variation

Engineering feasibility research I initiated pointed toward a shared enterprise foundation with site-level configuration for installed equipment, available signals, terminology, thresholds, and controls.

A feasibility projection, not achieved adoption or an impact metric.

Reflection & Takeaways

Reality check

What worked. What remained hard.

What worked

  • Connected framing resonated.
  • Local tools revealed reusable needs.
  • Shorter summaries and training supported comprehension.
  • Site pilots and feedback informed expansion.

What remained hard

  • Vendor boundaries and inconsistent site architectures.
  • Incomplete or uneven data.
  • Organizational ownership.
  • Standardization needed structural change as well as UI consistency.

Transferable pattern

From local optimization to system visibility.

  1. Identify where teams optimize locally
  2. Map upstream / downstream consequence
  3. Find signals already available
  4. Create shared interpretation
  5. Preserve role-specific decisions
  6. Surface enough runway to act

Useful anywhere local metrics obscure system-wide consequences.