
Making Operational Metrics Easier to Understand
A number could tell teams how equipment performed without making it obvious why.
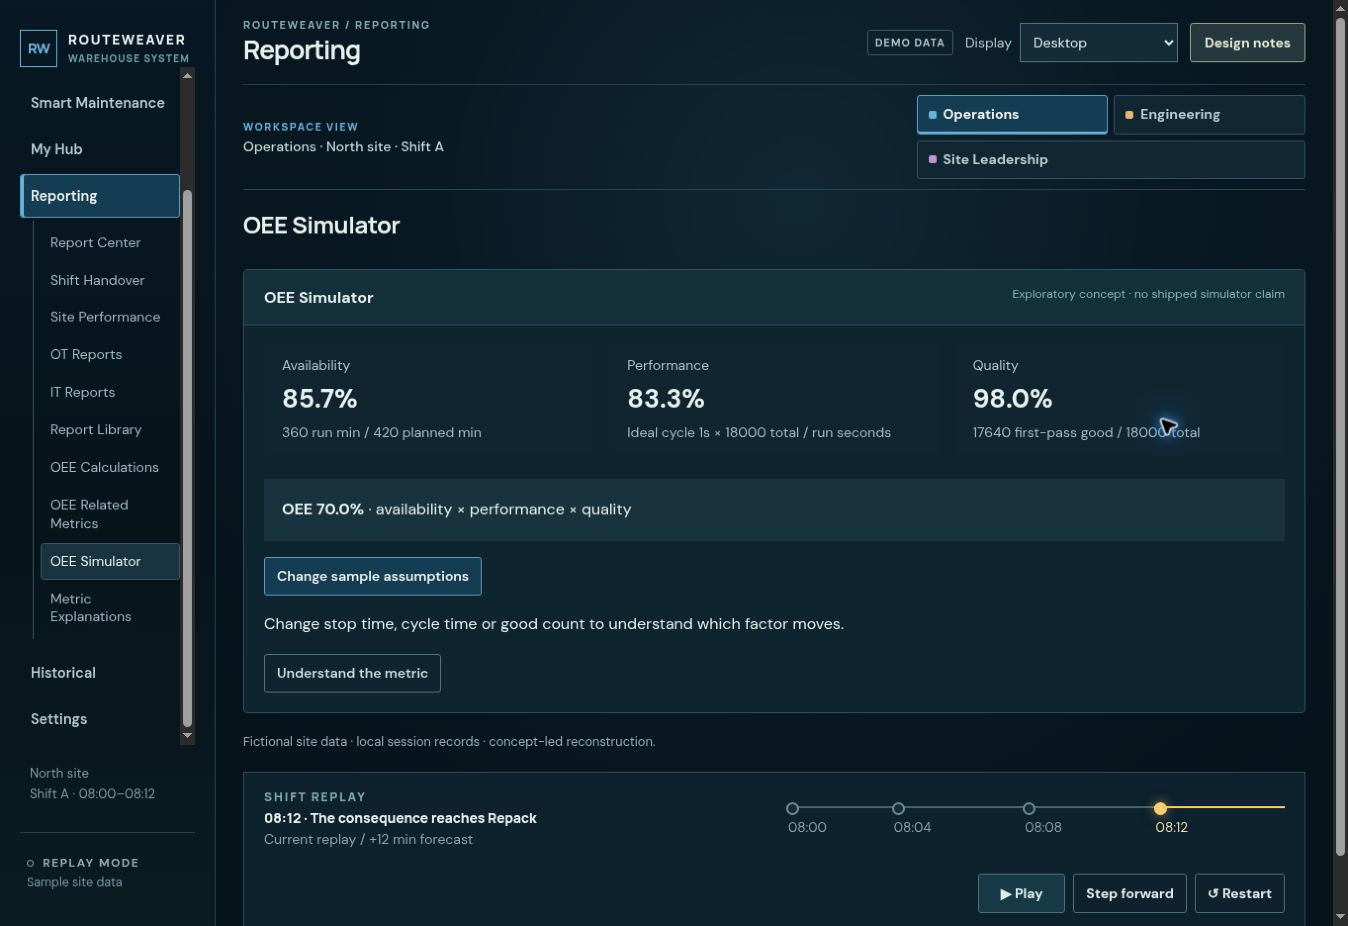
Jetson exposed Overall Equipment Effectiveness alongside formulas, calculations and surrounding measures. I reorganized the implemented experience to separate the primary OEE view from Calculations and Related Metrics, created supporting education, and explored a simulator for understanding how underlying factors affect the result.
IMPLEMENTED IA IMPROVEMENTS · TRAINING · CONCEPT
A number needs a path to a decision.
- MetricWhat happened?
- CalculationHow was it derived?
- EvidenceWhat influenced it?
- ContextWhat changed?
- InvestigationWhat can I inspect or adjust?
Visibility is not the same as interpretability.
OEE answered “how did we perform?” better than “why?”
The headline value, formula, detailed calculations and related operational measures were all relevant—but competed for attention. Users still had to reconstruct which component changed, how it was calculated and what to investigate next.
The metric was visible. The reasoning around it was not.
Separate the result from the explanation.
OEE
The primary performance view.
Calculations
How the metric was derived.
Related Metrics
Other measures that explain or contextualize the result, without implying they are calculation inputs.
Keep technical depth available without requiring every user to process it at once. Progressive disclosure supports both quick interpretation and expert inspection.
Evidence → decision → tradeoff
Evidence: the result, calculations and surrounding measures competed in one place.
Decision: separate the primary view from Calculations and Related Metrics.
Tradeoff: clearer information layers add navigation between them.
Resulting structure: quick interpretation and deeper inspection can coexist.
Turn the formula into something people can interrogate.
See
What happened? Read the OEE result and component values.
Understand
What contributed? Inspect formulas, definitions, calculations and related evidence.
Experiment
What if a factor changed? Explore the formula’s sensitivity rather than predict tomorrow.
CONCEPT · EDUCATIONAL SIMULATION · NOT PREDICTIVE MODELING
Availability × Performance × Quality
Change the illustrative component percentages to see how their product changes. These inputs are hypothetical, not site data.
Generalized formula demonstration, not a reconstruction of site-specific calculations, an operational recommendation or a validated forecast.
Investigate an unexpected OEE change
- See the current value and the unexpected change.
- Identify the changed component: Availability, Performance or Quality.
- Open its calculation and inspect the source.
- Check Related Metrics for supporting evidence.
- Interpret downtime, throughput, rejects or other conditions in context.
- Decide what requires investigation; the metric begins the analysis.
- Concept: vary factors in the simulator to understand sensitivity.
Generalized investigation workflow. The simulator step is separate from the implemented IA improvement.
Explore the factors behind OEE
Not every explanation belonged inside the interface.
For Target Together, I produced the physical Understanding Jetson OEE one-sheet: visual structure, layout, hierarchy and production / printing. Technical content came primarily from the PM and existing internal materials.
The design question was where people would encounter and learn the information effectively—not how much instruction could fit inside the dashboard.
View the generalized training reconstruction
Understanding OEE
A portable explainer for a metric people encountered in their day-to-day tools.
RECONSTRUCTION · A generalized learning pattern, not the original internal one-sheet.
The same questions should not require repeated tribal knowledge.
Definitions could be scattered across product screens, documentation, Workday training, one-sheets and experienced users. A contextual FAQ concept brought repeated questions closer to the metric.
Questions the knowledge concept could answer
- What does OEE measure, and how is it calculated here?
- Why might two areas have different values?
- Which related metrics should I inspect?
- What does Availability mean operationally?
- Who owns the underlying data?
CONCEPT · These are proposed learning questions, not a claim of shipped FAQ behavior.
What shipped. What remained conceptual.
OEE IA improvements, separate Calculations and Related Metrics, clearer organization, and physical OEE education for Target Together.
OEE Simulator, embedded FAQ and deeper interactive explanation of component relationships.
From original work to current prototype
Original work: existing OEE experience → IA analysis → separated views → implemented changes → training artifact → simulator / FAQ exploration.
Current reconstruction: recovered production structure → clarified interpretive model → AI-assisted exploration → Smart Warehouse reporting prototype.
Current portfolio methods are separate from the original delivery. The educational interaction on this page is a concept reconstruction.
Reality check: interpretation depends on the underlying metric
Clear layers, definitions, supporting evidence, training and an inspectable formula supported interpretation at different expertise levels.
UX alone could not resolve inconsistent source data, calculation differences, missing telemetry, the choice of operational target or agreement on definitions.
A clearer interface cannot compensate for a metric the organization has not defined consistently.
From metric visibility to metric understanding.
- Show the result.
- Expose the calculation.
- Connect supporting evidence.
- Explain terminology in context.
- Support exploration.
- Connect to the next investigation.
A number becomes useful when someone can trace it back to evidence and forward to a decision.